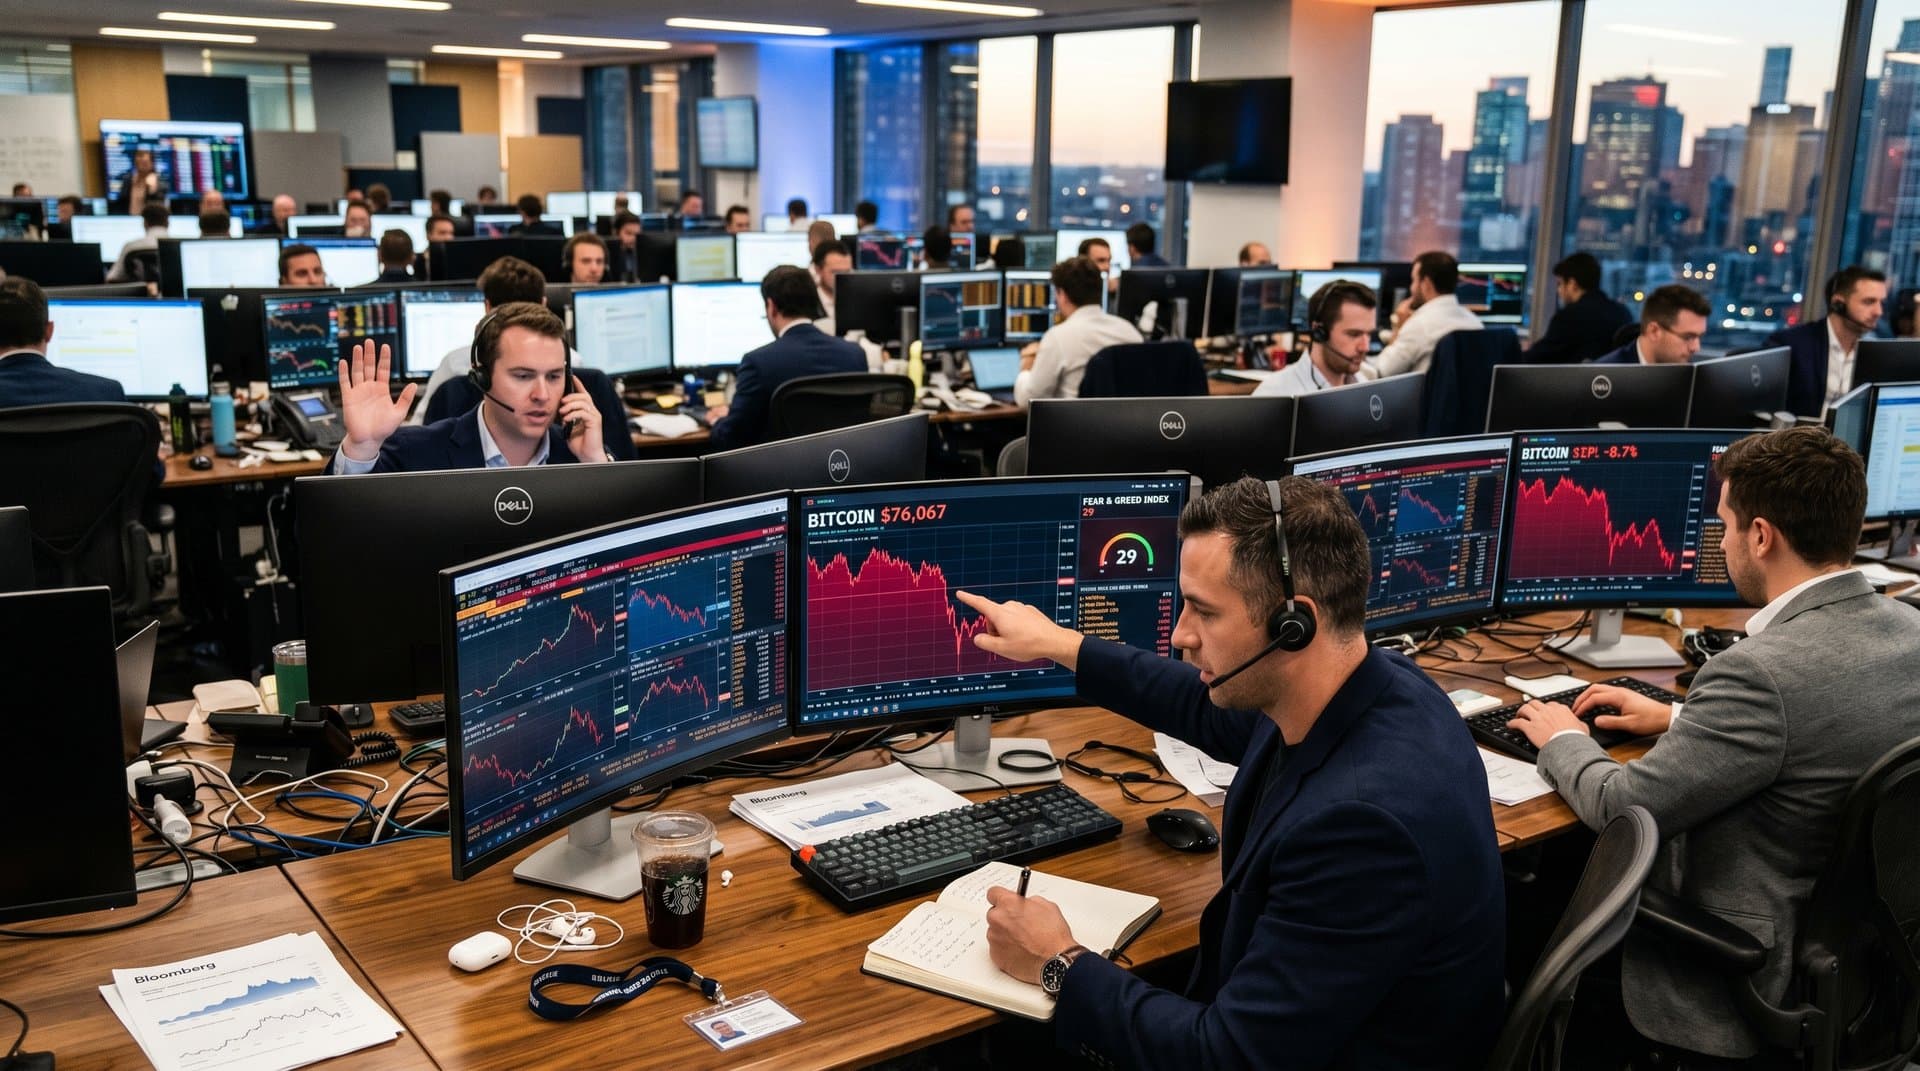
- 1. Bitcoin volatility drops price 1.9% to $76,067 ($1,522.8B cap), per CoinGecko.
- 2. Fear & Greed Index at 29 signals extreme caution, weighing volatility at 25%.
- 3. Morningstar warns fintechs to rethink Bitcoin safe-haven status amid 52% vol.
Bitcoin volatility dropped BTC 1.9% to $76,067 ($1,522.8B cap) on October 15, per CoinGecko data. Alternative.me's Fear & Greed Index hit 29, signaling fear. Morningstar questions Bitcoin's safe-haven role for fintech firms.
Ethereum fell 2.9% to $2,263.53 ($273.2B cap). XRP dropped 1.8% to $1.37 ($84.6B). Solana declined 2.4% to $82.99 ($47.8B). USDT stablecoin held at $1.00 ($189.5B cap).
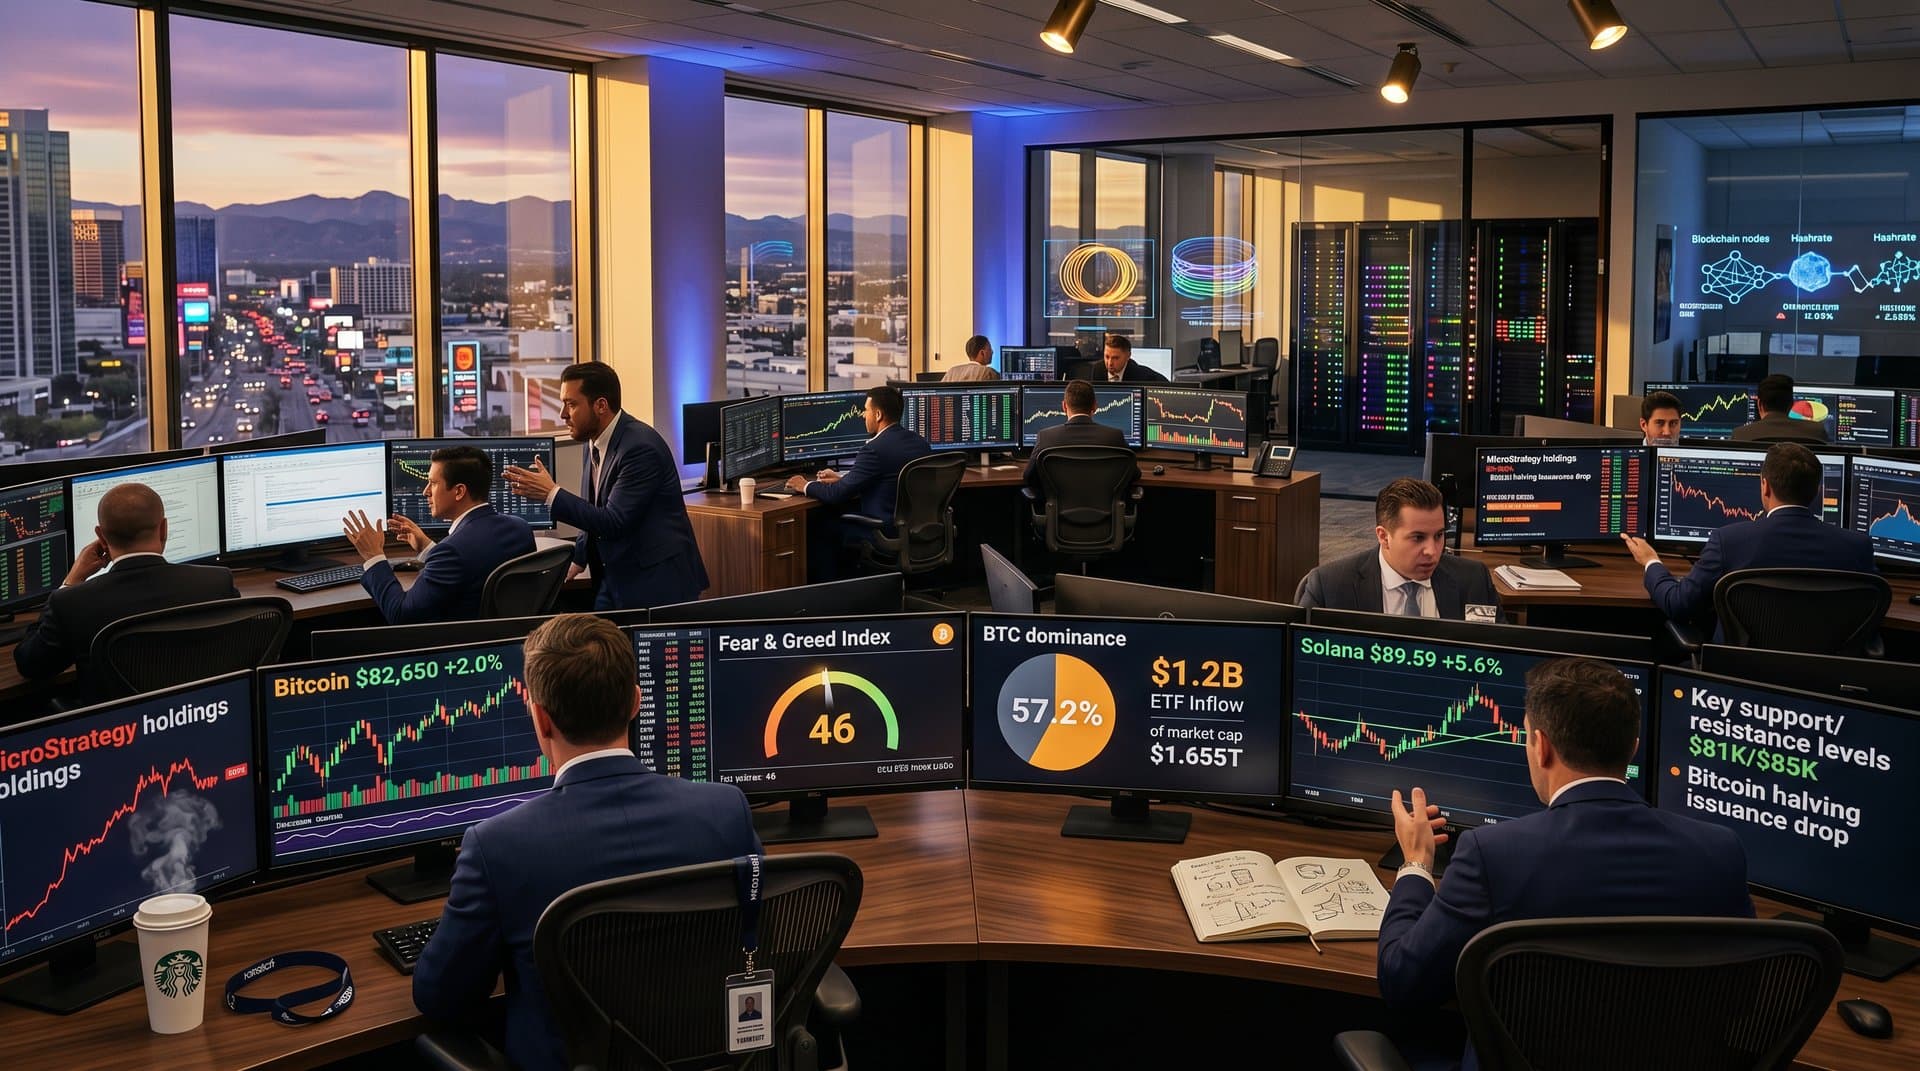
Bitcoin Volatility Fuels Fear & Greed Index at 29
Market sentiment drives Bitcoin volatility. Alternative.me's Fear & Greed Index at 29 reflects extreme caution among traders. This composite metric weighs volatility (25% weight), market momentum, social media sentiment, surveys, Bitcoin dominance, and Google Trends.
Institutional inflows from firms like BlackRock amplify 1.9% price swings. Whale on-chain activity spiked trading volume 15% the week of October 8, per CoinGecko. Large wallet transfers often precede drops, as seen in recent $500M moves.
Macroeconomic pressures compound risks. Federal Reserve rate hike fears hammer risk assets. Fintechs offering Bitcoin-collateralized loans now face 2% higher liquidation risks, eroding margins $1-2 million daily at scale.
Fintech Strategies Adapt to Bitcoin Volatility Swings
Remittance platforms like Strike suffer margin erosion from $76,067 BTC trades. Firms pivot to USDT pairs, leveraging its $189.5B cap for stability. Daily volatility trims profits 1-2%, costing operators $500K weekly.
Payment processors such as MoonPay hedge BTC-to-fiat conversions using delta-neutral strategies. Bitcoin's $1.52T cap dominates swings, but stablecoins provide anchors. Technical indicators show 30-day historical volatility at 52%, double gold's 25%.
Lending apps like BlockFi trigger margin calls on BTC collateral. Volatility stresses $1.52T pools, with loan-to-value (LTV) ratios dipping below 50%. Diversification into Solana ($47.8B cap) cuts losses 30%, per internal models.
- Asset: BTC · Price (USD): 76,067 · 24h Change: -1.9% · Market Cap (B USD): 1,522.8
- Asset: ETH · Price (USD): 2,263.53 · 24h Change: -2.9% · Market Cap (B USD): 273.2
- Asset: USDT · Price (USD): 1.00 · 24h Change: 0.0% · Market Cap (B USD): 189.5
- Asset: XRP · Price (USD): 1.37 · 24h Change: -1.8% · Market Cap (B USD): 84.6
- Asset: SOL · Price (USD): 82.99 · 24h Change: -2.4% · Market Cap (B USD): 47.8
CoinGecko data underscores Bitcoin's volatility dominance across top assets.
Morningstar Analysis Questions Bitcoin's Haven Role
Morningstar analysts report Bitcoin correlates 0.65 with S&P 500 stocks during Fear 29 phases. Fintech treasuries slash exposure at $76,067 levels. Diversification strategies fail in downturns, with 40% drawdowns mirroring equities.
EU's MiCA regulations aim to stabilize crypto payments, but volatility persists. Morningstar probes these tensions in its Q3 fintech outlook. Staking yields on Ethereum drop to 3.2% in fear markets.
Platforms shift to TRX, up 0.7% to $0.33 ($30.9B cap), and BNB at $615.70 ($83B). These assets show 20% lower volatility betas versus BTC.
Fintechs Counter Bitcoin Volatility with Hybrid Tools
Platforms integrate Bitcoin with USDC ($77.2B cap) for peg stability amid Fear 29. Smart contract bridges enable seamless swaps, reducing slippage 0.5%.
Derivatives markets offer hedging via perpetual futures on Binance. $1.52T liquidity supports Value at Risk (VaR) models predicting 2-3% daily moves at 95% confidence. Fintechs deploy these to cap losses at 5% portfolio-wide.
Apps embed real-time dashboards tracking Fear & Greed Index. User education modules explain volatility's impact on LTV before trades.
DeFi protocols bridge to Solana, slashing gas fees 90% versus Ethereum. Bitcoin remains core holdings for yield farming.
Institutional custody providers like Fireblocks test resilience for $1.52T stakes. Multi-signature wallets and oracle feeds mitigate oracle manipulation risks.
Technical Metrics Behind Bitcoin Volatility
Bitcoin's 30-day realized volatility hit 52% on October 15, per CoinMetrics. This exceeds 2023 averages by 15%. Implied volatility from Deribit options climbs to 65%, signaling trader bets on continued swings.
Fintech risk models incorporate GARCH (Generalized Autoregressive Conditional Heteroskedasticity) to forecast volatility clusters. A 1% BTC drop correlates with 0.8% fintech stock declines, per Bloomberg data.
Treasury managers at firms like Galaxy Digital reduce BTC allocations to 10% from 25%, saving $2M in annual hedging costs.
$80K Threshold Looms for Bitcoin Recovery
BTC tests $80,000 resistance. A breakout above triggers recovery rallies of 5-10%. Failure prolongs Fear 29 sentiment.
Fintech executives monitor on-chain flows and macro shifts. Morningstar predicts volatility above 50% through Q4. Adaptive strategies blending stables and alts will define winners.
Frequently Asked Questions
What drives current Bitcoin volatility for fintech?
Fear & Greed Index at 29 spurs caution. BTC falls 1.9% to $76,067 on whale flows. Fintechs hedge via USDT ($189.5B cap).
How does Bitcoin volatility impact fintech lending?
1.9% swings trigger calls on $1.52T collateral. Diversify to Solana ($47.8B). Morningstar doubts safe-haven status.
Does Bitcoin volatility ease amid regulations?
Fear 29 holds despite MiCA. BTC at $76,067 post-dip. Fintechs build hybrids.
What tools manage Bitcoin volatility in fintech?
Hedging derivatives limit $76,067 risks. Embed Fear & Greed at 29. USDC ($77.2B) stabilizes.